Fourth Quarter 2019
participate in an advance while also
providing downside protection.”
In honor of turning the page on a new decade, this letter is a little longer than usual. We’ll start with some reflection on the past ten years and work our way back to the most recent year and quarter as we go along.
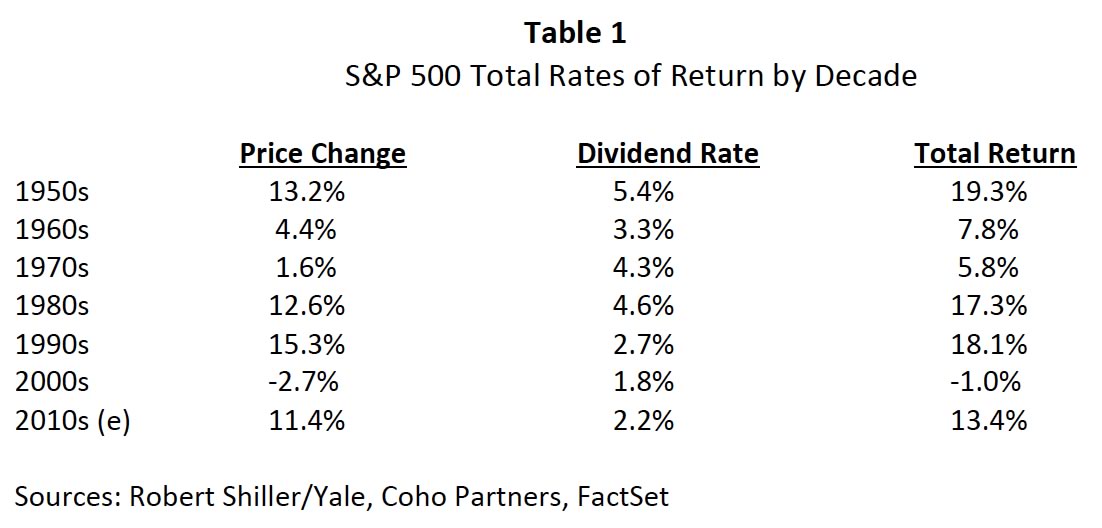
Table 1 shows annual total rate of returns by decade starting in 1950. As amazing as this past decade has been, it sits in the middle of the seven decades in terms of returns, despite having only one down year, a modest -4.4% in 2018.
We certainly ended the decade in a much different place from where we began. At the start of 2010, we had just emerged out of a decade of negative annualized returns for the market punctuated with two large bear markets (2000-02, 2007-2009) which were both at one point down 50% at their troughs and a severe recession. Unemployment sat at 10% and the S&P 500 Index started the decade at 1124. The weighting for the Technology sector was 19% and for Energy, 12%.
Chart 1 below shows both the Coho Relative Value Equity strategy, S&P 500 and S&P Value Index returns for the 2010-2019 decade, indexed at a starting point of 100. This entire decade was characterized by enjoying an uninterrupted period of both economic expansion and a bull market. We are currently enjoying a record long US economic expansion that started in 2009 and continues to this day, approaching the start of its 12th year. In addition, it has been a fairly sanguine period in the market with only two modest corrections greater than 10% over the course of a full quarter: -17.1% from May to September in 2011 in the beginning of the decade as the market worried about a possible double dip and -13.5% in the fourth quarter of 2018 during a period of increased Fed tightening. Unemployment ended 2019 at 3.5% and the S&P 500 at 3231. Technology today stands at 31% (including Google, Facebook and Amazon) and Energy at 4% of the index.
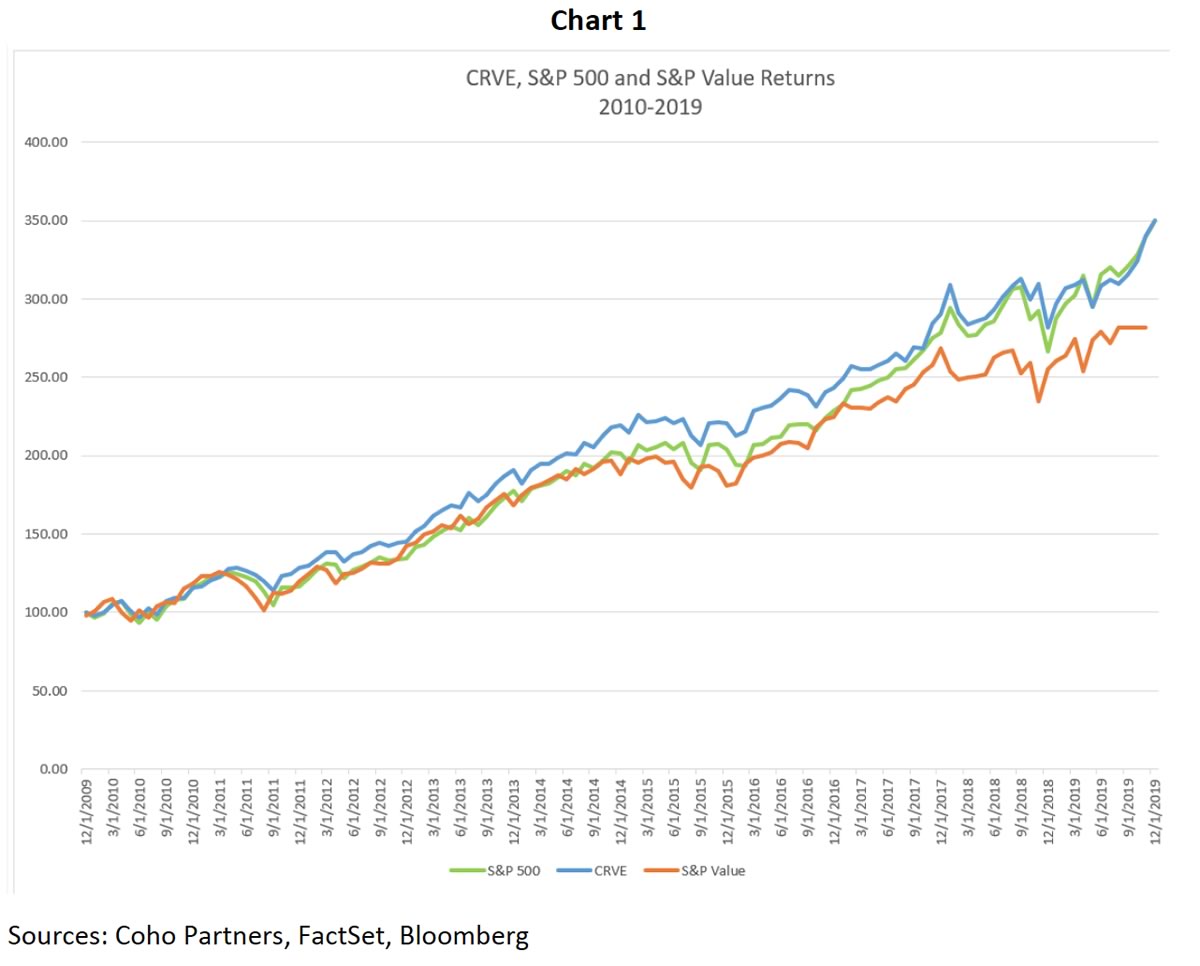
Over the past decade, the S&P 500 delivered a total return of 250.1%, or an impressive 13.4% compounded annually. Coho matched that almost exactly (+250.4%). Over the same period, the S&P 500 Value index returned 210%. The pattern of returns we strive to deliver targets 85-95% capture rates during periods of market expansion. Over a ten-year period of growth that included only two short, modest corrections, we are pleased to have exceeded that target range with a 100% capture rate versus the S&P 500 and a 119% capture rate compared to the S&P 500 Value.
In all fairness, it’s a different story when we analyze our relative performance over the course of the decade, particularly in the latter half. If you’re a regular consumer of our letters, webinars or presentations, then you’re likely familiar with how the Coho portfolio is always significantly tilted toward the more defensive (vs. cyclical) sectors, the lower beta and higher quality stocks vs. the market. For this reason, Coho divides the market cycle into different stages, characterized by which direction the market is moving and what the underlying drivers are. Bear markets/corrections are down markets where defensive and lower beta stocks typically outperform the index. These tend to be our best periods on a relative basis. Early bull and late bull markets are generally the strongest parts of the bull markets, notably driven by cyclical/higher beta stocks and momentum, which makes these markets our most difficult. The mature part of the bull market tends to be the longest, steadiest rising part of the market and has mixed participation of defensive/cyclical, low and high beta stocks. We have historically been in-line with these markets.
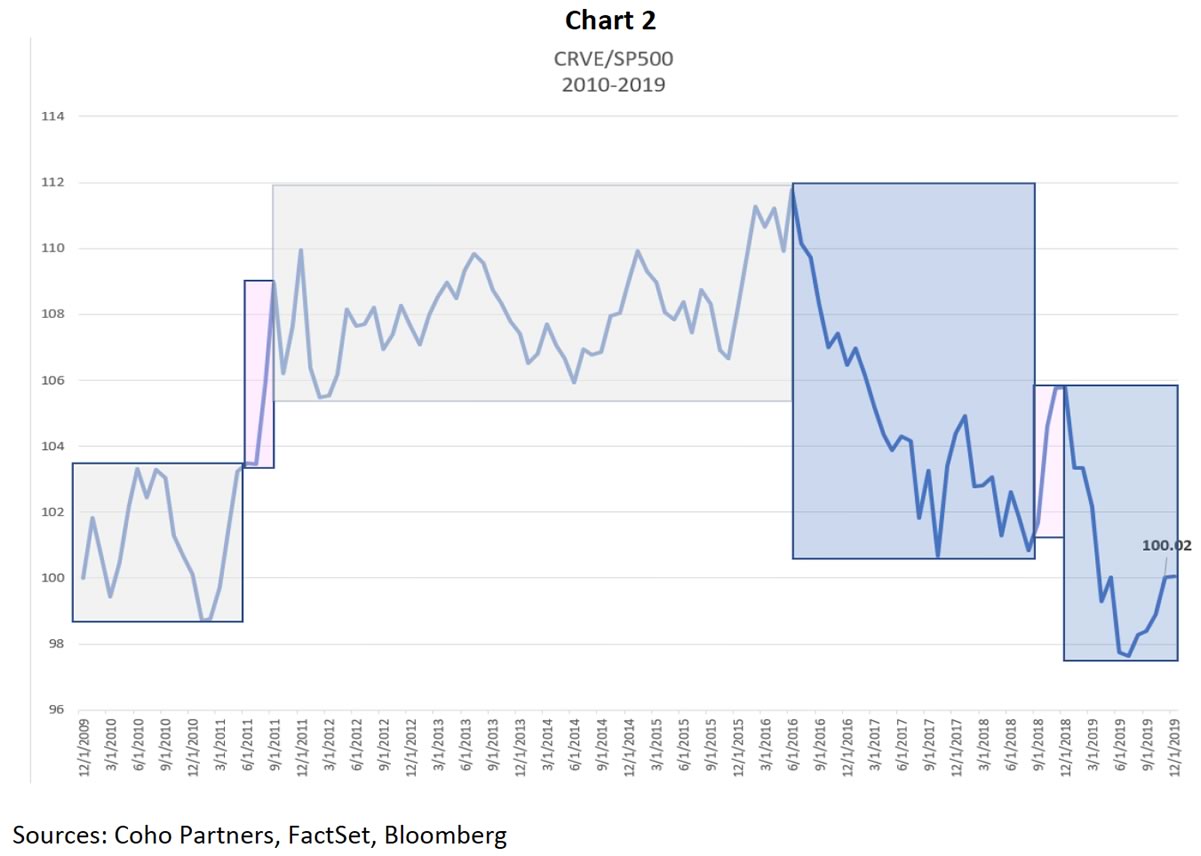
In Chart 2 below, we show the relative performance of the Coho Relative Value Equity strategy vs. the S&P 500 over the course of the last 10 years. We started the decade already about nine months into the new bull market and already into the mature stage (grey box), interrupted by a correction (pink) in 2011 amidst fears of a double dip. Coho outperformed the correction with solid tailwinds from our defensive and low beta stocks. The market resumed its climb for the next almost five years showing a steady rise with little underlying impact from the mix of cyclicality or beta and Coho built up a fairly nice lead on the market. Then, market returns accelerated starting in the summer of 2016 and we’d argue entered into the “late” stage, as the underlying tenor changed. Momentum, technology, cyclicality and beta became the distinct drivers and while Coho participated, our relative performance suffered, erasing most of the relative lead we had accumulated. A one quarter correction in 4q last year gained back some ground for us, but, 2019 was another full year of “late” stage bull market behavior, leaving us at the end of the decade up 250% on an absolute basis, but now dead even with the market on a relative basis.
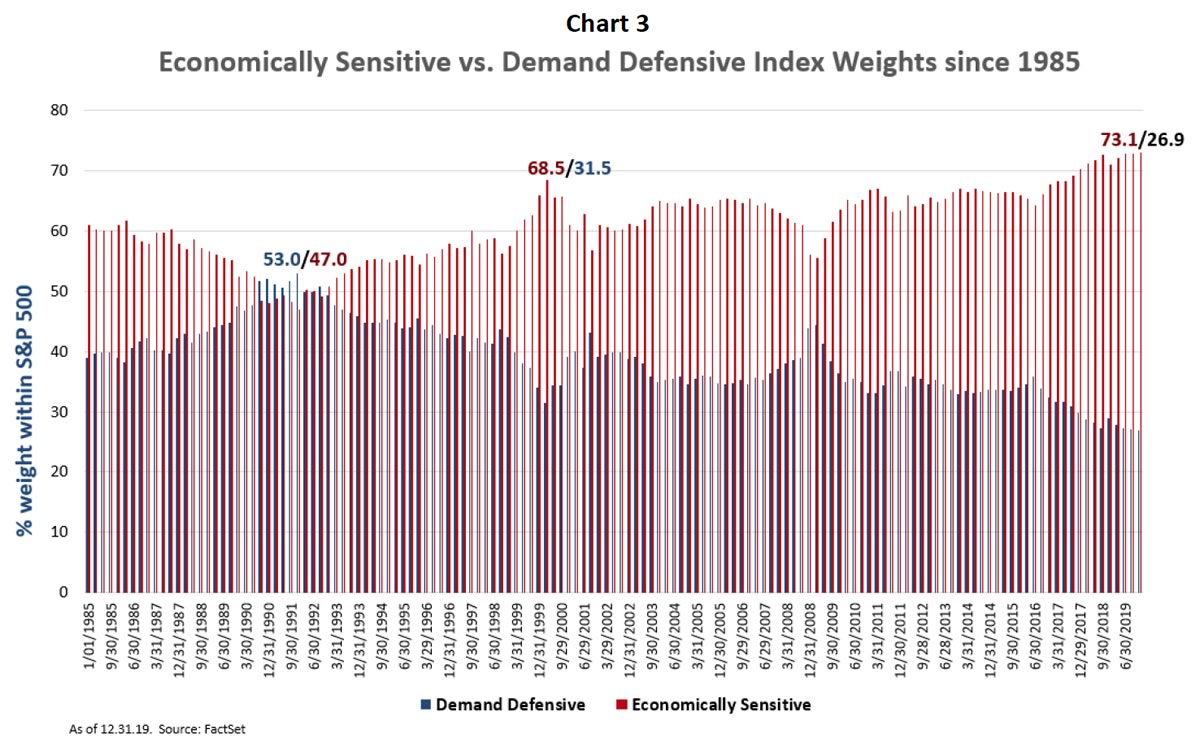
Examining the “late” bull in some greater detail, since that turning point in the summer of 2016, the S&P 500 is up 65%, with the three highest beta quintiles of the market up 94% and the two lowest beta quintiles up just 41%. Similarly, the economically sensitive sectors rose 79% and the demand defensive areas were up less than half that at 37%. This has pushed the market’s weighting on these economically sensitive sectors to a record high, at least since the data that we have been able to collect going back to 1985. The market now has 73% of its weight allocated to the more cyclical sectors, 5% higher than the peak of the technology bubble and about 8% higher than when the market/economy peaked before the Great Recession. While the US economy has indeed been experiencing fewer recessions (really only three in the last 30 years 1990, 2001, 2008), it does seem to be counter-intuitive for the market to be at an all-time peak cycle tilt 11 years into the longest expansion in our history.
Additionally, the market has been strongly favoring growth/momentum styles of investing for the better part of 13 years now, since the peak of the market/economy before the last recession. For the decade, the S&P 500 Growth index had an annualized return of 14.8%, while the S&P 500 Value Index return was 12.2%. Over the last 3 ½ years (late bull), the gap has been even wider, with the Growth index up 17.5% annualized vs. 12.9% for Value. Again, there is justification that the Value style had a huge run going into last cycle’s peak and that valuations/expectations had gotten too tilted away from growth. And the growth style tends to perform better in lower interest rate environments. But now, the relative P/E’s paid for growth stocks are at their highest levels going back to the unwinding of the tech boom back in 2002 while interest rates are sitting just higher than lows not seen since the 1950s.
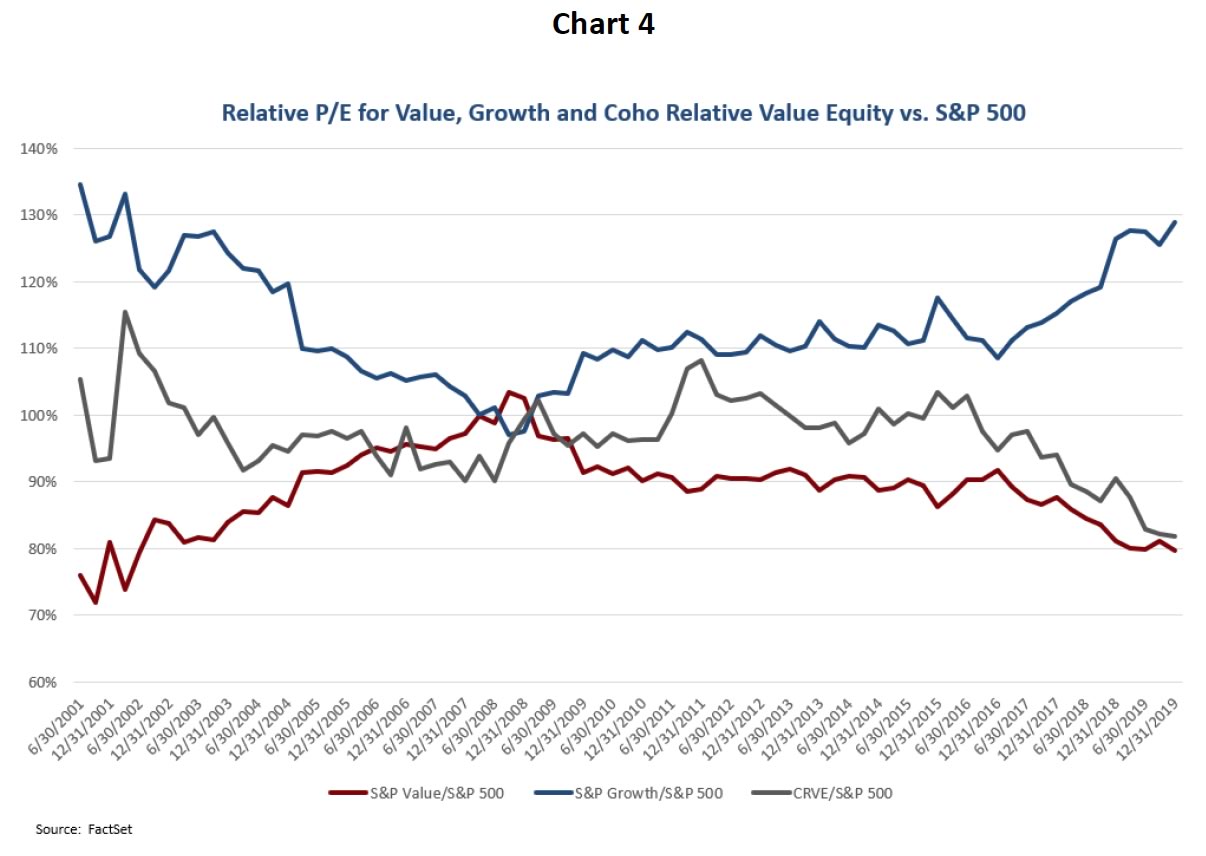
Note how our P/E has typically travelled in between the extremes measured by the P/Es on the growth and value indices. Our stocks have steady, predictable growth profiles and therefore typically do not get that distressed or that expensive. This has changed over this same 3 ½ year time frame as the gap between the growth “haves” and the value “have-nots” has exploded to levels not witnessed since the wind down of the technology bubble almost 20 years ago. The extreme valuation/sentiment gap between the market’s favorites and the ones they are leaving behind is too appealing to our dividend discount models and has driven us into some of the less expensive, more defensive areas of the market. Coho’s relative P/E is now as low as it has ever been.
Our fundamental, bottom-up driven process leads us to fade market extremes as our valuation framework ensures adherence to the goal of protection and participation. From the time the market made its decidedly cyclical shift in June of 2016, we have become more defensively postured relative to the market as shown in the table below. The current gap between our weighting in cyclical sectors vs. the market’s is close to an all-time trough (-29%) for Coho in our twenty-year history. The portfolio’s P/E multiple relative to the market is at the largest discount in our history (16.5 vs. 20.1). Our overweight of the lowest beta quintiles vs. the market (-24%) is up by 8% since 6/30/2016. The market moves around far more than we do, and we feel very good about our positioning as these dispersions reach extended levels.
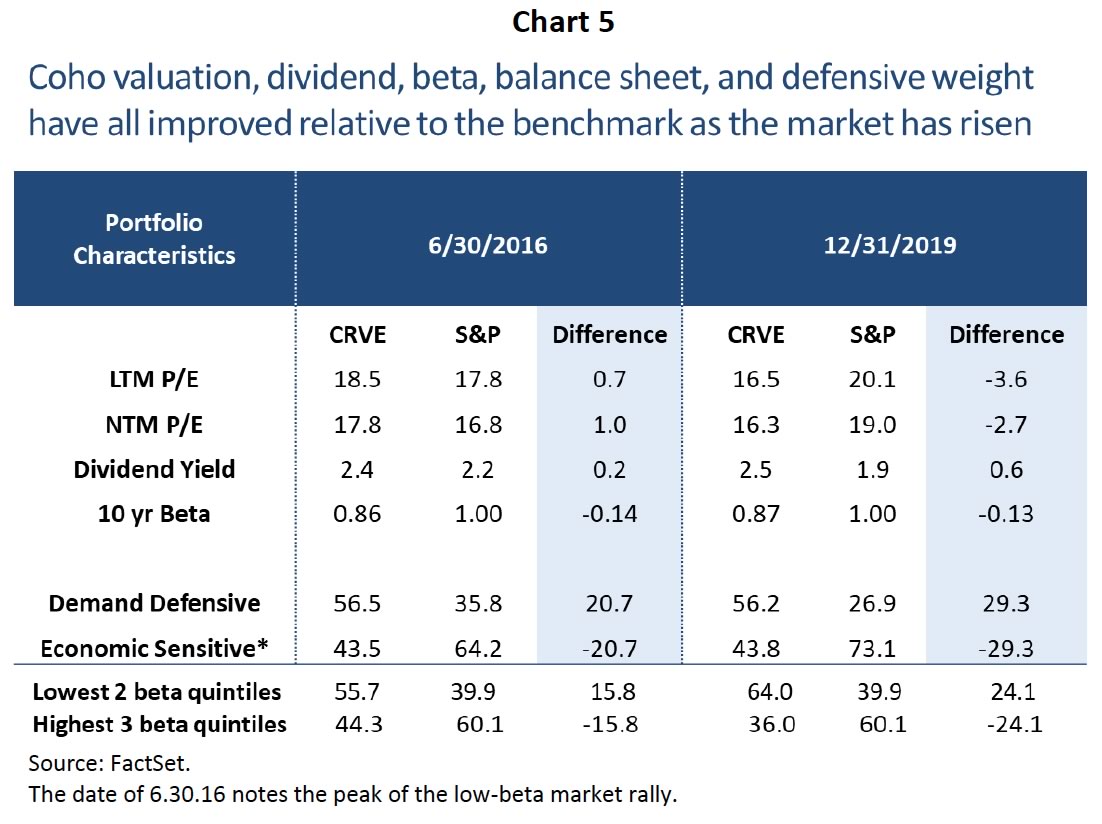
While our portfolio has become more defensively positioned, we feel confident that we can be competitive if the market continues to appreciate. We do not sacrifice growth for the sake of cheapness. Five-year trailing EPS growth for the Coho portfolio is +8.7% annualized vs. +7.9% for the S&P 500. Consensus estimates for Coho Relative Value EPS growth looking forward in 2020 are +7% while they are +9% for the market as a whole. Last year, (see table below) earnings did not end up mattering too much as earnings revisions for the market and Coho were very similar in the low single digits, but the market was awarded more multiple lift than Coho. Note in particular the market’s largest (and Coho’s most underweighted) sector, Technology, vs. Coho’s largest overweighted sector, Healthcare. There was a 30% difference in total return for those sectors as Technology’s 4% EPS gain was enhanced by a 42% boost (momentum?) in the P/E, while Healthcare’s 11% EPS only got a 7% gain (politics?) from P/E.
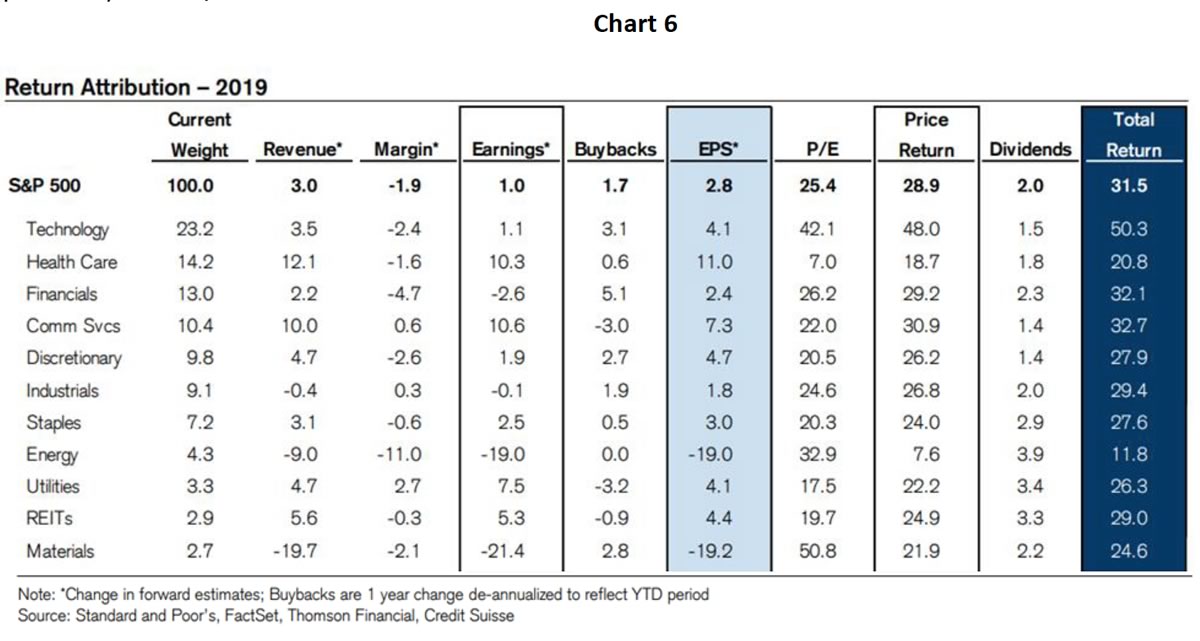
Focusing on 2019, it was a fantastic year for domestic equities. The S&P 500 advanced 31.5% and the S&P Value rose 31.9%. Coho Partners posted a return of roughly 24.4%, capturing about 77% of this outsized return. Since 1928 there have been 18 years with annualized returns greater than 30% so as amazing as this year feels, it tends to happen about every five years. Much like this decade, Technology lead the year’s advance with a 50.4% return and Energy lagged with a 10.5% return. A major headwind for us this year was the attribution from Amazon, Apple, Facebook, Google and Microsoft. These five companies accounted for 7.2% of the return this year or a remarkable 23% of the total.
The fourth quarter was particularly strong with the S&P 500 up 9.1% and the S&P 500 Value Index rising 9.9%. Coho Partners was able to capture all of this advance with a quarterly return of 10.9%. Healthcare and Technology were the two best sectors each rising more than 14%. Stock selection this quarter was good, with State Street and United Healthcare both up well over 30% and Altria and Amgen each up more than 20%.
December was yet another good month for equities as the broader benchmarks advanced more than 3% and we essentially matched this return. Energy lead the way this month with a 6% return, followed by Information Technology at 4.5%. Industrials lagged with essentially no return, but all of our Industrial holdings posted returns of 3% or more, so stock selection here was quite good. Our best holding was ConAgra, which advanced 18.6% (65.5% for the year) on a strong earnings report. Other notable advancers were Microchip Technologies, up 10.8% and Occidental Petroleum up 9.1% At the company level, one of the most important risks and opportunities we have been paying attention to over the past few years is disruption. Examples of companies in the portfolio that are constantly at the leading edge of the disruptive curve are Global Payments and Abbott Laboratories. The former is driving innovation in the digital payment processing field while the latter is changing the treatment paradigm for diabetics with its non-invasive glucose monitor and best-in-class heart valve repair technology. Two holdings that have faced some challenges over the past 18 months but are showing clear evidence of meaningful earnings improvement driven by their ability to disrupt elements of their business model to stay ahead of the competition include CVS and State Street. By integrating pharmacy, health care services, and payor capabilities, the former is well positioned for the consumerization of health care where consumers are responsible for a greater percentage of treatment costs. Meanwhile, State Street is the only company in the industry with the ability to offer a fully integrated suite of front- to back-office solutions for asset managers, many of whom currently use a patchwork of services from several companies, raising the risk of costly errors and inefficiencies, not to mention higher expenses.
In closing, we ended this decade much differently than when we started it. As mentioned, we began 2010 just exiting one of the worst recessions and bear markets in modern history, perhaps with cautious optimism, but definitely full of apprehension as to the future given what we had just experienced. We end 2019 still enjoying the longest economic expansion on record and one of our strongest bull markets, with huge runs in growth investing, momentum, cyclicality, valuation gaps and consumer and business confidence. Coho had a very good decade along with the index, but struggled with the late cycle market describing the last third of the 2010’s. Our current positioning sits comfortably (to us) at the other end of the spectrum, more defensively postured and value-oriented than usual, but still expecting steady growth from the companies in our portfolio, regardless of what the next decade may bring.
If you have questions or concerns about our outlook or the portfolio’s positioning, please do not hesitate to call us. We wish you all the best in the New Year and we look forward to updating you on the start of a new decade.
Sincerely,
Coho Partners’ Research Team
The views, opinions and content presented are for informational purposes only. They are not intended to reflect a current or past recommendation; investment, legal, tax, or accounting advice of any kind; or a solicitation of an offer to buy or sell any securities or investment services. Nothing presented should be considered to be an offer to provide any Coho product or service in any jurisdiction that would be unlawful under the securities laws of that jurisdiction. Past performance is not indicative of future results.