Coho Partners had a good June, both on an absolute and relative basis. The portfolio appreciated about 2% versus 0.6% for both the S&P 500 and S&P 500 Value Indices. Towards the end of the month we believe we saw the first inklings of a possible rotation away from big cyclicals and into some of the more defensive sectors, particularly Consumer Staples. We have not deviated from our valuation disciplines and as a result, the portfolio continues to favor Consumer Staples, Health Care and Integrated Energy for their consistent earnings, cash flows and dividend growth.
June’s strong performance enabled the portfolio to nearly match the S&P 500’s quarterly return of 3.4%, as the portfolio appreciated about 3.3%. The S&P 500 Value continues to lag with a gain of 1.4%. Stock selection was good, as evidenced by double digit quarterly returns from Occidental Petroleum (up 30%), Automatic Data Processing (up 19%), Kroger (up 19%), UnitedHealth (up 15%), Merck (up 12%), Chevron (up 12%) and Royal Dutch (up 10%).
For the first six months of the year, “growth” continued to dramatically outperform “value”. The S&P 500 Growth Index has advanced 7.3% as compared to a decline of 2.2% for the S&P Value Index. The year-to-date return for the S&P 500 Index falls in between at 2.6% and we are lagging that index by about 170 basis points with a return of just under 1%. The primary drag on our performance has been our overweight to Consumer Staples, which has been the worst performing sector so far this year. As mentioned earlier, it is possible that the tide may be turning for some of the more traditional defensive sectors.
There has been much fanfare about how growth companies have outperformed value companies over the past two years, but more importantly to Coho Partners, there has been a similarly lopsided market when comparing cyclical stocks to defensive ones. If you recall, Coho Partners divides the companies within our investment universe into two large buckets. One bucket consists of demand defensive companies, which includes Consumer Staples, Health Care, Integrated Energy, Telecom, and Utilities. The other bucket is much more economically sensitive and includes Financial Services, Technology, Industrials, Consumer Discretionary, Materials, and non-Integrated Energy.
The market continued its cyclical march this quarter with the economically sensitive stocks outperforming demand defensive companies by 120 basis points, 3.8% to 2.6%. This brings the year-to-date gap to over 600 basis points with cyclicals up 4.5% and defensives down 1.8%. We have mentioned in previous letters, the dramatic change in the underlying character of the market that occurred in the summer of 2016, when investors really started to favor economic exposure and beta. The cumulative gap since the end of the second quarter of 2016 is nearly 4000 basis points, as cyclicals have appreciated 49.0% versus 9.2% for defensive companies.
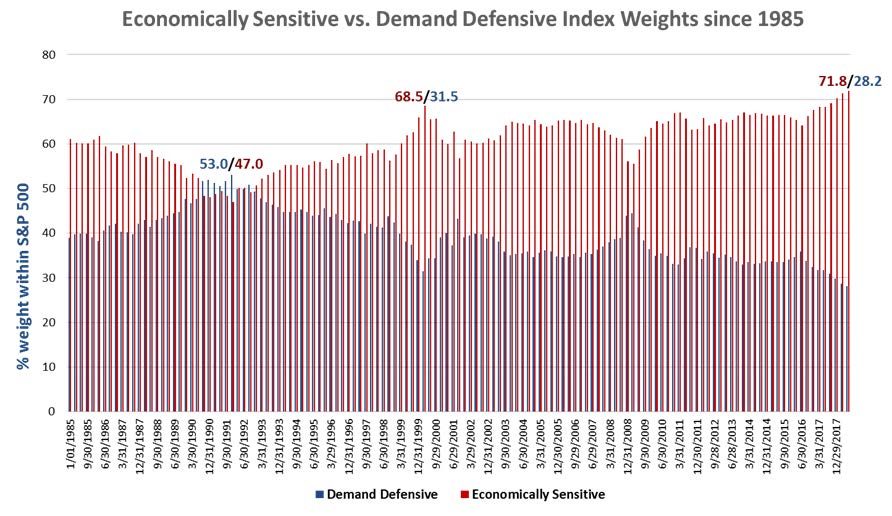
Typically, we spend much more time commenting on the portfolio than we do about the market. However, with this sustained cyclical versus defensive performance gap, the market has now decisively broken out to new highs in terms of the size of its tilt toward the cyclical sectors. In Chart 1 below, we show the S&P 500’s respective weightings in “demand defensives” and “economically sensitives” since 1985. The basic observation is directed at how much of the market’s capitalization is invested in cyclical stocks versus defensive stocks at any given time. As value-oriented investors, we are particularly interested in the extremes in such sentiment as compared to what happens next. In that vein, the lowest weight for cyclicals over this thirty plus year period was reached near the nadir of the early 1990’s recession when cyclical sectors represented slightly less than half of the total market at a 47% weight. From there it was a steady run over a long economic expansion to a peak of a 68.5% tilt toward cyclicals at the top of the technology boom in early 2000. Cyclicals declined significantly during the ensuing recession, subsequently climbing back during the next expansion, then corrected again during the financial crisis in 2008 and 2009. This current expansion and commensurate run in cyclical stocks is notable for two things. First, the duration is quite long at nine and a quarter years and second, the height of the cyclical tilt now stands at an all-time high of 71.8%. Conversely, defensive stocks now represent 28.2% of the market, which is an all-time low.

Source: FactSet
Although we create the portfolio from a bottom-up perspective, looking for business models that tend to be reasonably impervious to changes in the global economy, we still monitor the economic backdrop. From our perspective, the U.S. economy appears quite healthy with personal and corporate tax cuts providing fuel for spending and investment. Businesses are also benefiting from less regulation, which gives them more financial and operational flexibility. Other than levels of debt which have concerned us for years, we don’t see the obvious excesses that were present at previous economic tops. We do recognize that nine years into an economic recovery, combined with a Fed that is increasing interest rates, it is likely getting late in the game. Coho Partners does not make top down market calls in terms of what sectors we overweight, but we do monitor our balance between demand defensive companies and economically sensitive ones. We intentionally overweight the demand defensive companies because when corrections occur, those companies typically provide strong relative downside protection. We have been adding to demand defensive companies over the past two years because our dividend discount models suggest these companies have more attractive risk/return valuations as the market has left them behind. This reorientation has not yetadded value, but the market has yet to correct. We remain confident that following our disciplines will prove successful, and we like the portfolio’s positioning.
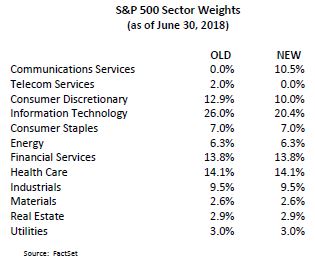
On September 21, S&P Global will realign some industry sectors which will impact roughly 11% of the S&P 500’s market capitalization. This realignment will not alter our investment process or any of our disciplines, but it will potentially distort the “defensiveness” of some historically defensive sectors. Specifically, S&P Global will create an entirely new sector called Communications Services. This new sector will include the prior Telecommunication companies plus selected companies from Consumer Discretionary and Communication Services. The new sector weights will look like this:

The previously named Telecom Services sector was often viewed as a defensive sector because of its high dividend yield and stable cash flow profile. The new Communications Services sector now includes some large and prominent growth companies such as Netflix, Google, Facebook, Disney, Comcast and eBay. We believe the new Communication Services sector, which will have a much more meaningful weight in the S&P 500 Index will prove to be less defensive given its reconstitution. The old Telecom Services sector was deemed 100% “value” name based, but the new Communications Services sector is more like 62% “growth”, 22% “value” and 16% “blended.”
We do not plan on altering the way we construct our Coho 250 and although this new sector has legitimate weight in the index, we are highly likely to minimize exposure to it.
The views, opinions, and content presented are for informational purposes only. They are not intended to reflect a current or past recommendation; investment, legal, tax, or accounting advice of any kind; or a solicitation of an offer to buy or sell any securities or investment services. Nothing presented should be considered to be an offer to provide any Coho product or service in any jurisdiction that would be unlawful under the securities laws of that jurisdiction. Past performance is no guarantee of future results. There can be no assurance that the portfolio will be successful in limiting volatility.
